
Test Results
This page will show you how to get your test results
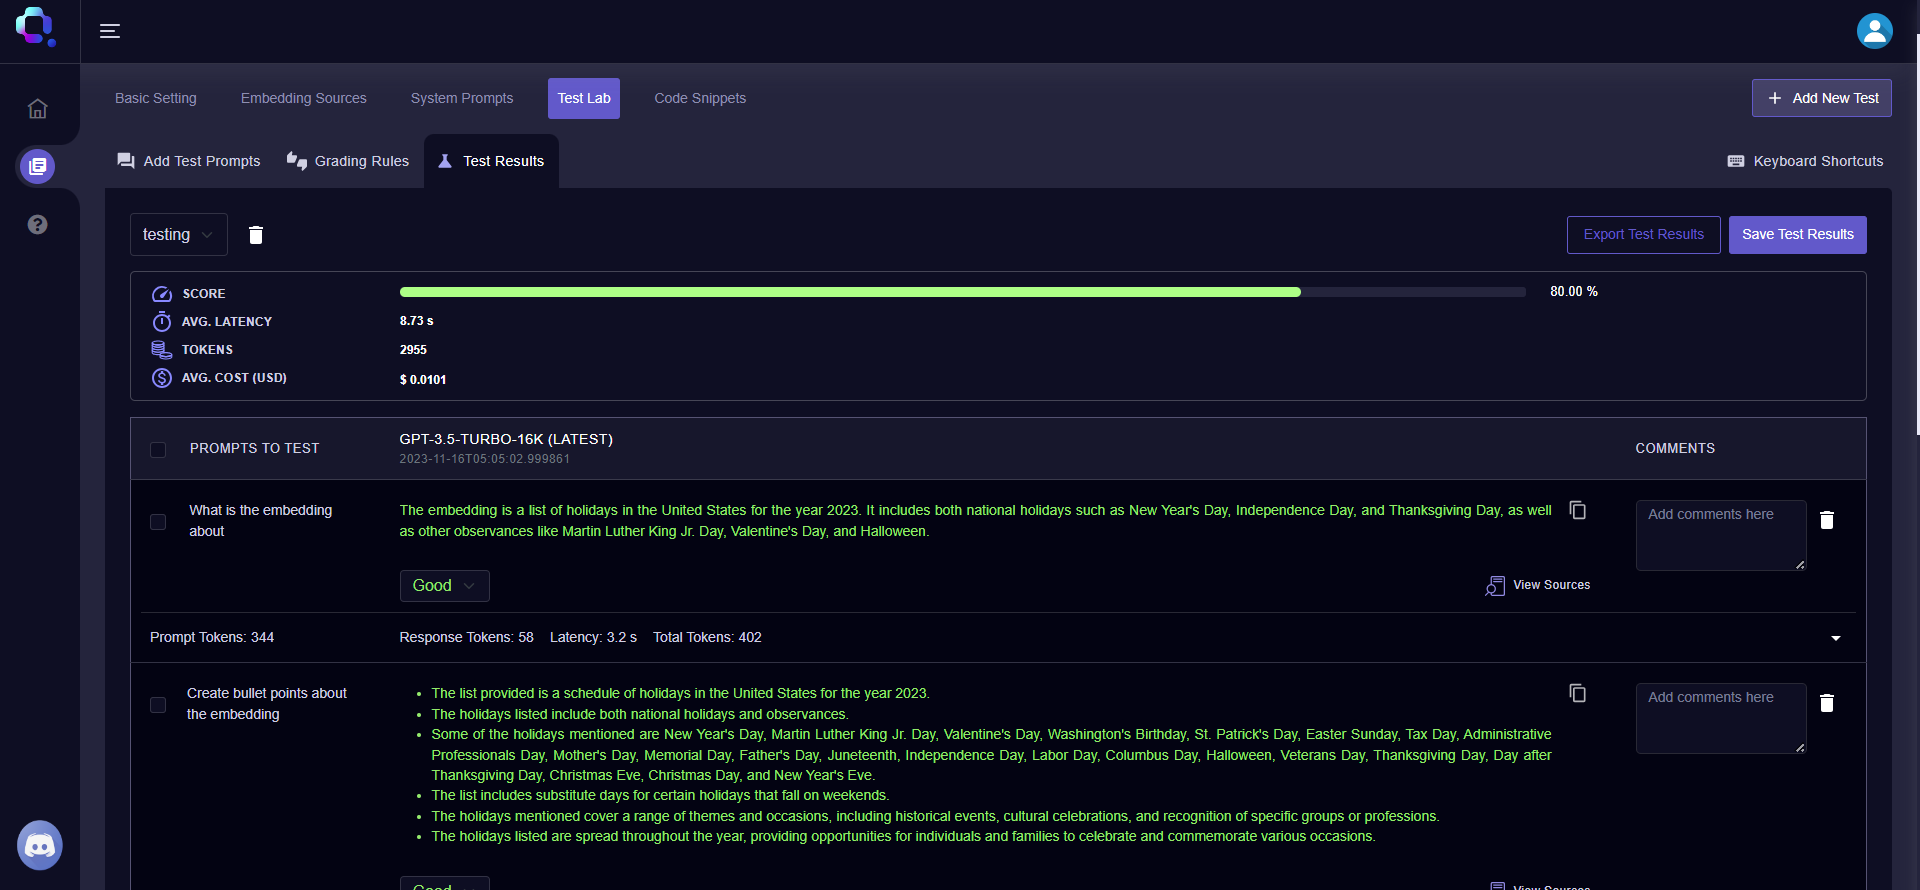
The Test Results tab is where the responses from the system prompt will be shown and graded. The grading can either be done manually or automatically depending on your preference.
Test Results is comprised of the following functions:
- Score This is the grade of your prompts. This will show a percentage of between 0% - 100% after all the response prompts are generated.
- Average Latency This shows the average latency of your prompts
- Tokens This shows the number of tokens that were used when running the test.
- Average Cost (USD) This shows the average cost per Input and Response prompt in United States Dollar ( USD)
- Save Test Results You can save your tests and review them.
- Export Test Results Your tests can be exported in XLSX format
- Table
- Prompts To Test: The generated prompts will appear in this column.
- Responses: Similarly, the responses, using the model defined, will be created here.
- Validation: This field allows the user to determine if the answer is correct or contains errors.
- Comments: Add comments to a row in the table
The table permits the user to visualize and store data in a congruent and simple manner.
Query Vary - Test Results Screen (Single Mode)
These are the Hotkeys to get the best experience of using the test lab table:
| Hotkey | Action |
|---|---|
| ↑ or ↓ | Navigate the table, row by row. |
| [Shift] + ↑ or [Shift] + ↓ | Maintains selection of the prompts as you move up or down. |
| [Shift] + [Ctrl] + ↑ or [Shift] + [Ctrl] + ↓ | Selects all the rows above or below from the selected row. |
| [Ctrl] + d | Deletes the selected row |
| Select row and press 1 | Manual rating for the response = Bad |
| Select row and press 2 | Manual rating for the response = OK |
| Select row and press 3 | Manual rating for the response = Good |
Updated over 2 years ago
Did this page help you?